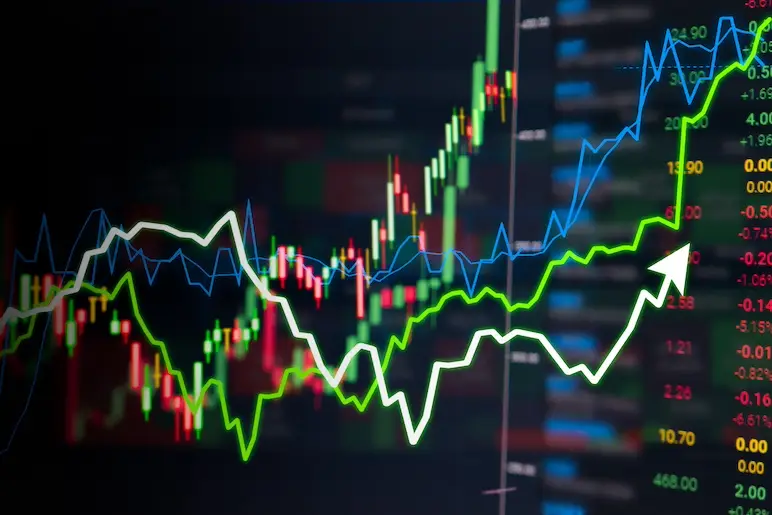
Image showing the graphical representation of the stock rates.
Global stock markets are treading a fine line between optimism and caution. Despite record-high valuations, investor confidence in technology, artificial intelligence (AI), and digital growth continues to drive the momentum. The market is not in a state of euphoria yet—but optimism is clearly outpacing economic caution.
Market Valuations Near Historic Highs
Equity markets are currently trading at valuation levels rarely seen in history. Indicators such as the Shiller Price-to-Earnings (CAPE) ratio and forward earnings multiples suggest stretched valuations. Analysts warn that such levels have often preceded periods of weaker performance or market corrections.
Historically, high valuations tend to predict lower long-term returns. Studies by economists Robert Shiller, John Campbell, and Clifford Asness indicate that valuation levels can explain nearly 40% of ten-year returns. Yet, investors remain confident in sustained growth driven by digital transformation and AI advancements. This gap between faith and fundamentals continues to fuel market imbalances.
Lessons from Market History
Market bubbles rarely burst at a specific valuation point. Instead, they tend to collapse when investor confidence weakens or narratives lose credibility. During the dot-com era (1998–2000), valuations reached record highs long before the crash, as optimism delayed reality.
Current high multiples do not guarantee an immediate downturn but increase vulnerability. As Campbell and Shiller noted, valuations can forecast long-term returns but not the timing of peaks. Investors, therefore, face the challenge of maintaining rational judgment in markets driven by emotion and expectation.
Uneven Impact: Large Caps vs. Small Caps
Valuation excesses affect companies differently. Large-cap firms often weather such periods better due to predictable profits and easier access to capital. Small caps, by contrast, are more exposed to rising interest rates and higher financing costs.
Research from LSEG and Morningstar shows that small caps outperform after correction phases but underperform during valuation extremes. In today’s environment, large technology companies dominate index performance, creating an illusion of overall strength. This narrow leadership has historically preceded sectoral rotations, underscoring the need for diversification.
The Confidence Factor and Market Fragility
The recent U.S. regional banking crisis highlighted how fragile confidence can amplify shocks. JPMorgan CEO Jamie Dimon compared the situation to “cockroaches—there’s never just one,” describing fears of hidden risks.
When valuations reach extremes, even small disruptions—such as defaults or accounting issues—can spark broader reactions. Economists agree that major corrections often arise from confidence shocks rather than fundamentals. The 2025 market reflects this paradox: valuations are elevated, risks persist, but warning signals remain subtle.
Technology at the Center of Risk
Sectors leading this rally—AI, semiconductors, and cloud computing—carry the highest valuations. According to Goldman Sachs, over 35% of global capital expenditure in AI is concentrated in just seven companies. This concentration raises vulnerability: if momentum slows, markets could correct even without earnings declines.
Conversely, traditional sectors like energy, materials, and utilities have more reasonable valuations. Analysts recommend balanced exposure between growth and value sectors to mitigate concentration risk.
The Limits of Valuation Models
Valuation models are useful but imperfect. They assume stable economic conditions, interest rates, and investor behavior—assumptions often disrupted by technological revolutions. Just as the internet transformed productivity in the 1990s, AI may be reshaping profitability expectations today.
If technological growth delivers as expected, high valuations could remain justified. However, any disappointment could lead to sharp corrections. In the short term, psychology and monetary policy still outweigh valuation metrics.
Indicators to Monitor
Key valuation indicators are flashing warnings. The forward P/E ratio of the S&P 500 hovers near 24, while the Shiller CAPE stands around 40—levels historically linked to weaker long-term returns. The price-to-sales ratio for tech stocks exceeds 8x, its highest since 2021.
At the same time, inflows into technology ETFs are surging while market hedging activity is declining. This divergence between optimism and protection signals complacency. The widening gap between sector valuations further indicates rising imbalance.
Outlook: Optimism Meets Gravity
History shows that markets do not fall simply because they are expensive. They fall when confidence fades. As of 2025, optimism around AI and digital innovation continues to fuel growth, but the margin for error is shrinking.
Caution is not pessimism—it is discipline. Investors may find that prudence is the final luxury before the next correction.